The Summary
Users - Help me communicate to the sales team what marketing initiatives each account has seen to customize outreach.
The Business - Building a tool for Sales that lives in their app of choice (Salesforce) to increase our product’s penetration into an organization and consequently its stickiness
Results - $250K revenue in our Advanced Analytics package, +1,000% daily unique users, +27% engagement (+7pp WAU/MAU) for adopted customers
The Problem
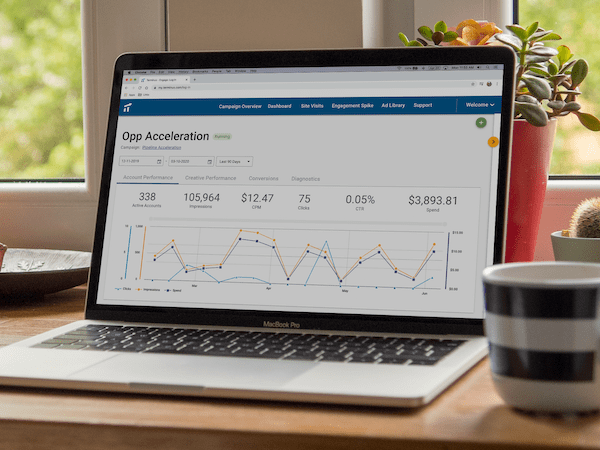
In the beginning of 2019, Terminus’ Chief Product Officer laid out his vision for improvements to an existing feature of the product. Terminus’ Opportunity Journey lays out how the Salesforce Contact object interacts with an opportunity over time. This allows a marketer to understand when there were periods of higher interaction (illustrated by the steeper curve), and then attribute those periods to activities the marketer undertook, such as emailing lists or purchasing ad space. Naturally, knowing which types of activities are most effective helps you maximize your ROI: if something is working, spend more money there!
We knew that marketers were excited about this feature and it came up constantly in our sales calls. Our goal was to take this feature and data and deliver them in a way that sales could best consume, ultimately driving better sales and marketing alignment. It turned out the process of researching this feature was a perfect case study for the UX process, and we made major pivots before we committed engineering resources.
The Research
After discussing the problem space from the business perspective, we set out to discover our customers’ pain points. First, we worked with our customer-facing teams to identify customers that would be a good fit for the outcome of this project. The first round of interviewees were positive and it was clear that marketers wanted these tools to help drive alignment with sales.
While conducting these interviews, I also brushed up on current best practices for graph design. I found a lot of tips and tricks, but the most important piece of advice was to design with data. The form and shape of data influences design at its core; without having data to work from, you risk future re-work as you refine and increase the fidelity.
We used Trello to organizer the research insights.
Two weeks into the research process, we interviewed our first internal salesperson and, while hard to hear, his feedback was the most valuable. Our main question to validate was "If you had this resource for a year and then your boss took it away, would you be disappointed?" (A variation on the question that Superhuman uses in their Product/Market Fit Engine.) This person gave us a resounding no. For him, the key pain point in the sales process was deciding who to call, and giving him all this raw data just provided another noisy signal to process. This sentiment was shared by further interviews with sales. We took a step back and decided to focus instead on this insight. We needed to better understand the signals salespeople already used and augment or improve them instead of giving them a new signal they didn’t want.
The Design
This research completely shifted our design and we moved quickly to prototype out a tabbed interface that included "insights" front and center. The difference in our interviews was immediate. After a round of feedback we showed it to the salesperson who initially gave us negative feedback, and he had a complete 180. His new response to having the feature turned off was "I would be pretty pissed if this was taken away. Please give this to me before we give it to any of our customers," and he sent us another email the following morning: "I continued to think about what you showed me yesterday after we met (clearly I liked what I saw)."
The key to solving this problem was recognizing that the solution we had been working on was for the wrong person. Sales had a very different set of needs, and by listening to them we were able to turn a feature into a win that would have been a miss otherwise
"I would be pretty pissed if this was taken away. Please give me this before we give it to any of our customers"
The Reflection
Looking back at this project over a year later, I’m struck by how much mileage we got out of our MVP. Many times “MVP” is used as an excuse to cut features and scope, while promising that there might be iteration in the future. In my experience that iteration doesn’t come, and users are left with a compromised experience.
By contrast, Terminus’ Account Journey feature is a key differentiator, and is brought up often by the sales team as the feature that clinches the deal. One widespread industry problem is the ability to quantify and measure engagement as opposed to traditional B2B marketing metrics, like leads. The account insights journey is a compelling overall view into engagement as a whole, and this type of analysis is becoming more central to the platform as they move forward.


